
Table of Contents
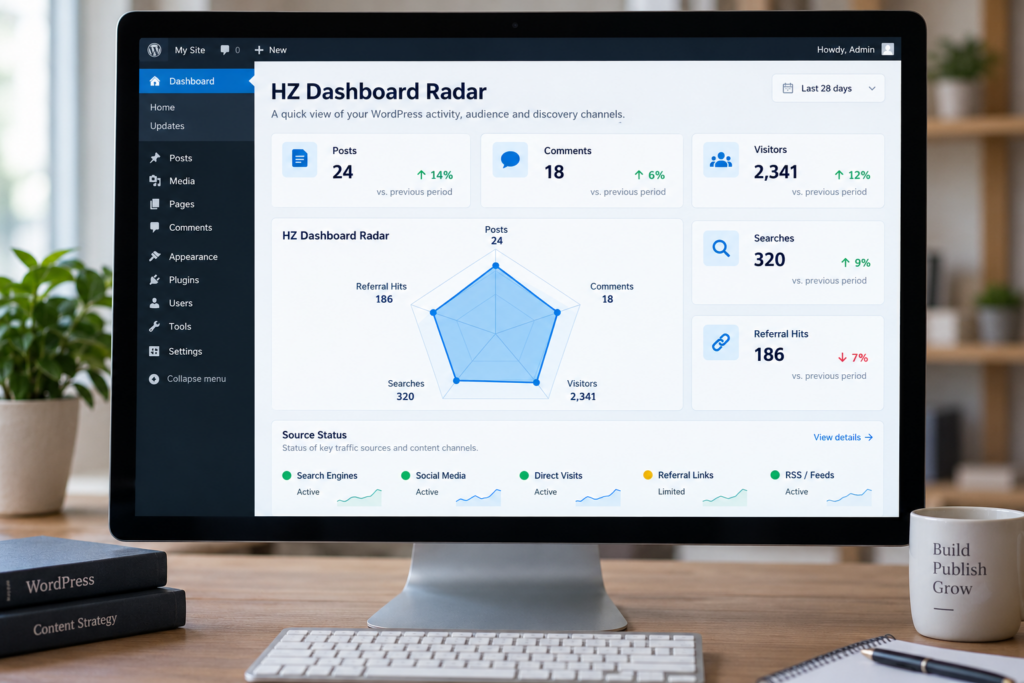
HZ Dashboard Radar turns useful WordPress site statistics into a clean visual dashboard. Learn how the plugin displays posts, comments, visitors, searches, referral hits, trends, source availability, and normalized radar data while keeping real values visible and avoiding invented statistics.
What Is HZ Dashboard Radar?
Managing a WordPress website often means moving between several screens just to understand what is happening. You may check the Posts screen for published content, open Comments to review engagement, inspect another plugin for visitor information, and use yet another tool to understand searches or referrals. The information exists, but it is scattered across the administration area.
HZ Dashboard Radar takes a different approach. Version 1.0.0 creates a compact visual overview directly inside the WordPress Dashboard. Instead of trying to become a full analytics platform, the plugin focuses on a small collection of useful site indicators and presents them together.
The central feature is a radar visualization built around five possible metrics: Posts, Comments, Visitors, Searches, and Referral Hits. Below the chart, individual cards show the actual values and identify their sources. The plugin also indicates whether each source has been detected and can display simple trends when enough information exists. This distinction matters. A visual dashboard should make information easier to understand, but it should not create numbers simply to make a chart look complete. HZ Dashboard Radar deliberately allows a metric to remain unavailable when a compatible source cannot be found. That design makes the dashboard more transparent. A missing statistic may look less impressive than a full chart, but it tells the administrator something useful: WordPress currently has no recognized local source for that particular measurement.
Why a Visual WordPress Dashboard Can Be Useful
WordPress already provides a capable administration interface. However, as a website grows, the amount of information available to an administrator also grows. Content, comments, optimization plugins, security tools, statistics, backups, SEO features, and other systems can all compete for attention. A visual summary can reduce that cognitive load. Rather than reading several unrelated numbers, the administrator receives a compact overview of selected site activity. The radar does not answer every analytics question, but it can provide immediate orientation after signing into WordPress. This is especially useful for website owners who manage their own installations. A publisher may simply want to know whether the site has accumulated more content, whether comments are changing, and whether compatible local counters are recording additional activity. Opening a full analytics platform for every quick check may not always be necessary. The WordPress Dashboard is also an appropriate place for this type of feature. WordPress provides an official Dashboard Widgets API that developers can use to add custom information panels to wp-admin. HZ Dashboard Radar follows this general WordPress model by registering its own dashboard widget. A good dashboard should still remain a starting point rather than the final destination. Detailed traffic attribution, conversions, search performance, audience segmentation, and long-term analytics require dedicated systems. HZ Dashboard Radar is better understood as a local overview that complements those tools.
The Five Metrics Behind HZ Dashboard Radar
The radar is organized around five categories. They look similar when displayed on the chart, but their underlying data sources are not identical. Understanding that difference is essential when interpreting the widget. Posts and Comments come from WordPress itself. Visitors, Searches, and Referral Hits require compatible local data sources. Therefore, two WordPress installations running the same plugin may display different combinations of available statistics. That behavior is intentional. The plugin first checks whether it has a legitimate source for a metric. When no supported source exists, the relevant card can show that the source was not detected rather than manufacturing a placeholder value. This approach also means the radar can adapt to different WordPress installations. A simple blog may initially provide only content and comment information. Another site with compatible local tracking tables may populate all five categories.
Posts
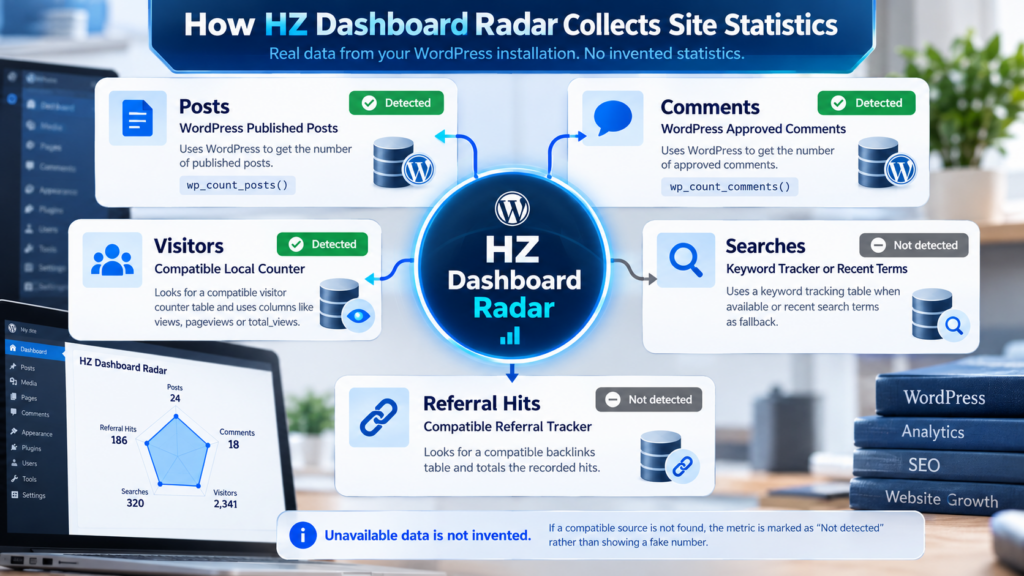
The Posts card represents the number of published standard WordPress posts. The plugin obtains this information through WordPress rather than maintaining a separate post counter.
WordPress provides the wp_count_posts() function specifically for retrieving post counts by status. The official developer documentation describes it as an efficient method for determining the number of items belonging to a post type.
HZ Dashboard Radar reads the published count. As a result, drafts, trashed posts, and other statuses are not simply combined into the displayed Posts value.
The card is also actionable. Selecting it can take an authorized administrator directly to the WordPress Posts screen. That small feature turns the statistic into a shortcut rather than leaving it as a decorative number.
Comments
The Comments metric follows a similar principle. Instead of estimating engagement, the plugin reads the approved comment count available through WordPress.
WordPress provides wp_count_comments() for retrieving site comment statistics. Its result separates approved comments from pending, spam, trash, and other states. HZ Dashboard Radar specifically uses the approved count for this card.
This makes the value easier to interpret. It represents comments that have passed moderation and are approved rather than every comment record that may exist in the database.
The Comments card is clickable as well. It can lead directly to the comment-management screen, giving administrators a fast route from overview to management.
Visitors
Visitors are more complicated because WordPress core does not automatically provide a universal visitor counter that can be interpreted in the same way on every installation.
HZ Dashboard Radar therefore looks for recognizable local counter structures. Version 1.0.0 checks compatible tables and searches for known view-related columns such as views, pageviews, or total_views.
When a supported structure is detected, the plugin can total that column and display the result as the Visitors value. The source label identifies the local table and column used for the calculation.
When no compatible counter is available, the plugin does not substitute a random traffic figure. Visitors remains unavailable and the source status explains that no visitor counter was detected.
This behavior is important because page views, visitors, sessions, and users are not automatically interchangeable analytics concepts. Website owners should interpret the displayed value according to the local counter that supplies it.
Searches
The Searches card can use a local keyword-tracking source when one is available. In the examined version, the plugin checks for a WordPress database table associated with keyword tracking and can total recorded visits from that source. A fallback is also supported through stored recent search terms. However, this fallback represents a rolling collection of recent terms rather than a lifetime search-hit counter. The plugin labels that source accordingly and notes its limited nature. If neither source exists, the Searches card remains unavailable. This is a sensible distinction. A list containing recent search terms does not mean the same thing as a historical total of all search requests. Showing the source alongside the number helps prevent those two concepts from being confused.
Referral Hits
Referral Hits also depend on an additional local data source. The plugin checks for a compatible backlinks table and, when found, totals the recorded hit values. If that table is not present, the card reports that no referral tracker has been detected. Referral data can be useful for identifying external activity around a website, but the meaning of the number still depends on how the underlying tracking system records a hit. It should not automatically be interpreted as unique visitors, sessions, or confirmed SEO backlinks. That is another reason the source label is valuable. The card tells you not only that a number exists but also where HZ Dashboard Radar obtained it.
Why the Radar Uses Normalized Values
A radar chart creates an interesting technical problem. The five statistics do not naturally share the same scale. Imagine a mature WordPress website with 1,500 published posts, 8,000 approved comments, 250,000 recorded views, 700 searches, and 4,000 referral hits. Drawing those raw numbers directly on one radar chart would make the largest counter dominate the visualization.
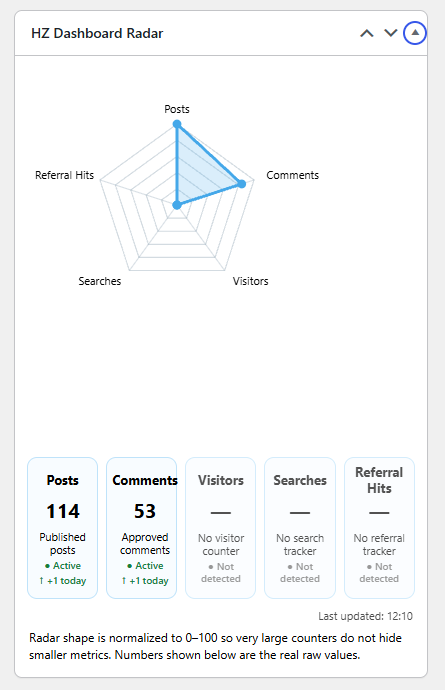
The smaller metrics would become difficult to see even though their raw values could still be meaningful. HZ Dashboard Radar addresses this by normalizing the chart values to a scale between 0 and 100. The visual radar therefore represents the relative scale of available counters rather than plotting the raw database numbers directly. Importantly, the cards below the chart continue to display the real raw values. This creates two separate layers of information. The radar provides a quick visual comparison, while the cards preserve the underlying numbers.
Logarithmic Normalization Explained Simply
Version 1.0.0 uses logarithmic normalization for the radar.
That sounds technical, but the purpose is straightforward. Large numerical differences are compressed so that a very large counter does not visually erase every smaller one.
The plugin calculates a logarithmic representation of each available raw value, finds the largest comparable value, and converts the results to a 0–100 scale.
The largest available counter will therefore tend toward the outer part of the radar, while smaller counters appear proportionally closer to the center after logarithmic compression.
The normalized number is not presented as the site’s actual traffic or engagement total. It is a visualization score. That difference is fundamental.
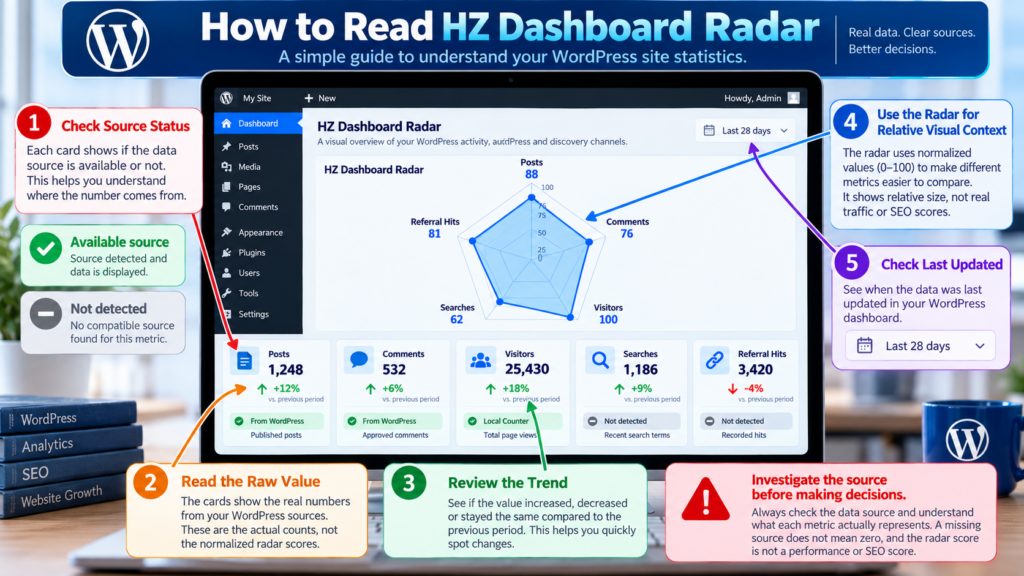
If the Visitors card shows 25,000, for example, the number displayed in the card remains 25,000. The radar may plot that metric at a normalized position such as 90 or 100 depending on the other available counters. The chart position does not replace the raw value.
Why Normalization Makes the Radar More Readable
Without normalization, comparing heterogeneous counters would usually produce an unattractive and misleading shape. One metric could occupy almost the entire chart while several others collapse near the center. Normalization improves visual balance.
However, it should not be used to make performance judgments across unrelated categories. One hundred published posts and one hundred referral hits describe completely different things. The radar does not claim that these events have equal business value.
Instead, it answers a narrower question: how large are the currently available counters relative to one another after compression for visualization? The note displayed under the widget reinforces this distinction by explaining that the radar shape uses a normalized 0–100 scale while the cards contain the real raw values.
Understanding the Trend Indicators

Static totals are useful, but website administrators often want to know what changed. HZ Dashboard Radar therefore includes simple trend indicators. The plugin creates local snapshots of available values. At the start of a new day, it stores a baseline. As the underlying counters change, it compares the current value with that baseline. A positive difference can produce an upward indicator. A negative difference can produce a downward indicator. When no change has occurred, the interface can report a flat state or use the previous snapshot to describe yesterday’s movement.
The first time a usable baseline becomes available, the plugin can display a “Baseline set” message.
This design keeps the trend system lightweight. It does not build a full historical analytics warehouse or create complex time-series reports. Instead, it provides immediate directional context around the current counters.
What “Today” Means
The current snapshot uses the date supplied by WordPress. Therefore, the trend calculation follows the site’s WordPress date configuration rather than independently assuming a timezone.
The baseline remains fixed during the day. If a value increases after that baseline was recorded, the difference can appear as today’s increase.
For example, suppose the site had 500 approved comments when the daily baseline was created. If the count later reaches 504, the Comments card may indicate an increase of four for the day. The same principle can apply to other available counters.
Why a Negative Trend Is Not Automatically Bad
A downward arrow needs context. For cumulative statistics such as published posts or approved comments, a reduction may indicate that content was deleted, moved to another status, or moderated differently. It does not automatically mean that the website is losing popularity. The same caution applies to local counters whose data can be cleaned, reset, imported, or modified by another plugin. HZ Dashboard Radar reports a numerical change. It does not determine why the change occurred. Administrators should investigate unusual movements before drawing conclusions from them.
Real Tooltips Make the Chart Easier to Understand
Charts become less useful when users cannot connect a point with its underlying value. HZ Dashboard Radar addresses this through tooltips. When chart support is available, interacting with a radar point can expose the original raw value associated with that category rather than presenting only the normalized visual score. This is a useful usability decision. The chart may need normalization to remain readable, but the administrator still needs access to the actual statistic. Tooltips bridge those two representations. For example, a radar point may visually sit near the outer edge because its normalized score is high. The tooltip can still identify the metric and report its actual raw number.
Unavailable metrics are treated differently. Instead of pretending that zero is a confirmed measurement, the interface can identify the item as unavailable. That prevents a missing data source from being confused with a genuine measurement of zero.
Source Status Makes Missing Data Visible
One of the strongest aspects of the plugin is also one of the simplest: source status.
Each statistic card includes information about the source behind the value. When the source is available, the card can show an active state. When the expected source cannot be found, the interface identifies it as not detected. This approach makes troubleshooting easier. Suppose Posts and Comments work, but Visitors shows no number. That does not necessarily indicate that the radar plugin itself has failed. It may simply mean the WordPress installation has no compatible local visitor counter. Likewise, a missing Referral Hits value can indicate that the expected referral-tracking table does not exist. The administrator receives a more useful message than an unexplained zero.
Zero and Unavailable Are Not the Same
This difference deserves emphasis. A value of zero means the data source exists and currently reports zero. An unavailable value means HZ Dashboard Radar does not have a supported source from which to obtain the measurement. Those states should never be treated as equivalent.
Imagine a brand-new website with a properly functioning search tracker. If nobody has performed a recorded search yet, zero may be a legitimate result.
Now imagine another website without a search tracker. Reporting zero searches would imply that tracking exists and has observed no searches. That would be misleading.
By allowing the metric to remain unavailable, the plugin preserves this distinction.
Clickable Cards Turn Statistics Into Shortcuts
A dashboard becomes more useful when information leads naturally to an action. HZ Dashboard Radar makes the Posts and Comments cards clickable. Selecting Posts opens the appropriate WordPress content-management area, while Comments provides direct access to comment administration. This may sound like a small feature, but it improves workflow. Imagine logging into WordPress and noticing that the comment count has changed. Instead of opening the navigation menu and searching for the relevant screen, you can move directly from the dashboard card to Comments. The same principle applies to Posts. Not every card is clickable because not every data source has a universal WordPress management destination. A locally stored visitor counter, for example, may come from another plugin with its own interface or no interface at all. Keeping links limited to meaningful destinations avoids creating buttons that do not have a reliable purpose.
Last Updated Provides Useful Context
Every statistics interface needs some indication of freshness.
HZ Dashboard Radar includes a “Last updated” line using the WordPress time configuration. This gives administrators a basic reference for when the current dashboard rendering occurred. The value should not be interpreted as proof that every external or local source collected new data at that exact moment. It identifies when the radar widget itself was rendered with the values it could retrieve. That distinction becomes important when another plugin supplies a counter. The radar can read the current stored value, but the original tracker controls when and how that value is collected. Still, showing an update time is better than presenting numbers with no temporal context. For routine dashboard use, the timestamp helps users understand that they are looking at the current widget rendering rather than an unexplained cached screenshot.
Mobile Compact Layout Matters for WordPress Administration
WordPress administration no longer happens exclusively on desktop computers. Site owners may check comments, update posts, or inspect a dashboard from a phone or tablet.
A radar chart that looks attractive on a wide monitor can quickly become difficult to read on a narrow screen. Labels can collide, cards can become uneven, and the chart may require unnecessary horizontal scrolling. HZ Dashboard Radar includes responsive CSS intended to adapt the visualization and statistic cards to smaller screens. The chart width becomes flexible, the visual area adjusts to the available space, and the cards can use a more compact grid. Typography and spacing are also reduced where appropriate.
The goal is not to reproduce the desktop interface pixel for pixel. A good mobile dashboard should prioritize legibility and efficient use of limited space.
Why Responsive Admin Tools Are Important
Many WordPress plugins concentrate heavily on their front-end responsive design while treating wp-admin as a desktop-only environment. That assumption is increasingly inconvenient. A publisher may receive a moderation notification while away from a computer. A developer may need to check a site quickly from a phone. A small-business owner may use a tablet as the primary management device. A compact dashboard widget can therefore be more useful when it remains understandable across multiple screen sizes. HZ Dashboard Radar’s mobile behavior is primarily a usability feature rather than an analytics feature, but it can make the statistics significantly more accessible in everyday use.
How HZ Dashboard Radar Integrates With WordPress
HZ Dashboard Radar uses WordPress’s dashboard system rather than creating a separate administration application. The plugin registers its widget during the dashboard setup process. WordPress officially exposes the wp_dashboard_setup hook for dashboard-related customization and recommends wp_add_dashboard_widget() for adding custom dashboard widgets. This means the radar behaves like a WordPress dashboard component. Its front-end assets are also restricted to the relevant administration screen. In version 1.0.0, the plugin checks the current admin hook before loading its radar stylesheet and chart script. That is a sensible performance choice because a dashboard visualization does not need to load on every WordPress administration page.
Capability Check
The widget registration includes a WordPress capability check. In the reviewed version, users need the edit_posts capability before the radar widget is registered for them. This is more flexible than checking only for the Administrator role because WordPress capabilities can be assigned to different roles depending on the site’s configuration.
Website owners with complex editorial teams should still evaluate whether the selected capability matches their privacy requirements. Some local statistics may be considered administrative information even when users are allowed to edit posts.
For a private site or a multi-author environment, capability decisions should always match the site’s actual workflow.
Local Data Has Advantages and Limitations
HZ Dashboard Radar is designed around locally available WordPress information. That offers several practical advantages.
The widget can display WordPress content and comment information without requiring a remote analytics account. Compatible local tracking tables can also be read directly from the WordPress database. This keeps the dashboard experience simple. However, local data is not automatically superior to dedicated analytics. The available information depends heavily on what the WordPress installation actually records. A site without a compatible visitor counter cannot suddenly obtain historical visitor data simply by installing the radar. The same principle applies to searches and referral hits. HZ Dashboard Radar visualizes recognized information. It does not reconstruct data that was never collected.
It Is Not a Replacement for Google Analytics
A dedicated analytics service can provide dimensions that this radar does not attempt to reproduce.
Depending on the analytics system and configuration, administrators may be able to investigate traffic channels, devices, geographic patterns, events, conversions, sessions, landing pages, campaigns, and many other dimensions. HZ Dashboard Radar intentionally has a much narrower scope. Its advantage is convenience. You can see selected local counters immediately inside WordPress. Its limitation is depth. For serious marketing analysis, conversion tracking, audience research, or advertising decisions, website owners should continue using appropriate analytics and reporting platforms.
It Is Not a Replacement for Google Search Console
Searches inside a WordPress website should not be confused with Google Search queries.
The Searches card can represent activity recorded by a compatible local search-tracking mechanism. Google Search Console, by contrast, provides information about a site’s performance in Google Search. These are fundamentally different datasets.
A visitor typing “WordPress security” into your site’s internal search box is not the same event as somebody searching Google and clicking your result.
HZ Dashboard Radar should therefore complement search-performance tools rather than replace them.
Privacy Considerations for Local Statistics
Privacy should be considered whenever a website records visitor activity.
HZ Dashboard Radar itself focuses on reading recognized counters and presenting aggregate values. However, the privacy implications of Visitors, Searches, or Referral Hits depend on the systems that originally collect those records.
A simple aggregate page-view counter may store very little information. Another analytics plugin may collect IP addresses, user identifiers, URLs, timestamps, referrers, device information, or other data.
The radar cannot make every upstream tracking implementation privacy-compliant merely by displaying its totals. Website owners should review each tracking source separately.
They should understand what is collected, why it is collected, how long it is retained, whether consent is required, and which legal or contractual requirements apply to their operation.
This is especially important for websites serving users across jurisdictions with different privacy rules.
Performance Considerations
Dashboard plugins should remain lightweight because WordPress administrators already run numerous scripts, styles, queries, and background operations. HZ Dashboard Radar limits its assets to the main Dashboard screen. This prevents its chart-related CSS and JavaScript from being unnecessarily loaded on unrelated wp-admin pages.
The plugin also relies on WordPress’s own count functions for core statistics such as Posts and Comments. For compatible local counters, database totals may still require queries against the relevant tables. The cost of those queries depends on table size, schema, indexes, server resources, and how frequently the dashboard is loaded. For a typical small or medium WordPress installation, these operations may be modest. However, extremely large datasets deserve individual testing.
Administrators should evaluate real server behavior rather than assuming that any analytics query is free.
Why Dashboard Performance Still Matters
Visitors do not normally see wp-admin, but administrator performance still affects productivity.
A slow dashboard makes routine maintenance frustrating. It can also become more noticeable on shared hosting or installations with many plugins. Developers should therefore avoid loading unnecessary libraries everywhere and should keep database operations focused.
HZ Dashboard Radar’s decision to load its presentation assets only on the Dashboard is consistent with that principle.
As the plugin grows, maintaining this discipline will become increasingly important. Additional metrics, historical graphs, API integrations, or automatic refresh systems could increase resource requirements if implemented without care.
Installing HZ Dashboard Radar
HZ Dashboard Radar can be installed as a standard WordPress plugin package when you have the plugin ZIP file. Before changing any WordPress installation, create a suitable backup. A backup is especially useful when replacing an older version of a custom plugin because the installation process modifies files inside the plugins directory. From the WordPress administration area, open the plugin installation screen and choose the option to upload a plugin. Select the HZ Dashboard Radar ZIP package and proceed with installation. If WordPress detects an existing version of the same plugin, carefully confirm that you are replacing the intended installation. Do not intentionally keep multiple active copies of different versions in separate folders unless the plugin developer specifically designed them to coexist. After installation, activate HZ Dashboard Radar and return to the main WordPress Dashboard.
The widget should appear for users who satisfy the required capability check.
What to Check After Activation
Start by looking at Posts and Comments. Because these values come from WordPress core information, they provide a useful initial test. Compare the numbers with the relevant WordPress management screens. Next, inspect the source status for Visitors, Searches, and Referral Hits.
Do not expect all three to become available automatically.
If the site does not have a compatible local tracking source, “Not detected” is a legitimate result rather than evidence that the plugin must be broken.
Finally, resize the browser or inspect the dashboard from a mobile device. Confirm that the chart labels and statistic cards remain readable at the screen sizes you normally use.
How to Interpret the Radar Without Misreading It
The most important rule is simple: do not treat the radar as a quality score. A larger shape does not automatically mean a better website. Consider Posts. Publishing more articles increases the count, but quantity alone says nothing about accuracy, originality, usefulness, search performance, or reader satisfaction. Comments have similar limitations. A large comment count can reflect an active community, but it can also be concentrated on old content. A smaller site may deliberately disable comments and still be extremely successful. Visitor counters can also differ in methodology.
Therefore, the radar should be treated as an orientation tool.
Use it to notice relative scale and changes. Then investigate the underlying metric before making an important decision.
Look for Changes Rather Than Perfect Shapes
Radar charts often encourage people to imagine that a symmetrical shape is ideal.
That assumption does not apply here.
There is no reason a healthy WordPress site must have equal proportions of posts, comments, visitors, searches, and referral hits. These metrics represent different activities and can vary dramatically according to the site’s purpose.
A documentation website may have many searches and relatively few comments.
A community blog may generate large numbers of comments.
A portfolio may publish very few posts.
An established news archive may contain thousands of articles.
None of those patterns is automatically correct or incorrect.
The useful question is whether the numbers and trends make sense for your own website.
Practical Ways to Use the Dashboard
One useful habit is to treat HZ Dashboard Radar as a first-stop diagnostic screen.
After signing into WordPress, scan the source statuses. If a metric that normally works suddenly becomes unavailable, investigate the plugin or table that supplies it. Then look at the trends. An unexpected decrease in published posts may deserve attention. A sharp change in comments could reflect moderation activity. A local visitor counter that suddenly stops increasing may indicate that its tracking mechanism has stopped recording data.
The radar itself can help reveal unusual differences, but the raw cards should remain your primary numerical reference.
Another practical use is content administration. Because Posts and Comments provide direct links, the widget can shorten the path from observation to action.
Use It Alongside Other WordPress Health Checks
Statistics are only one part of WordPress administration. A complete maintenance routine should also consider updates, backups, security, PHP compatibility, database health, caching, performance, uptime, SEO configuration, and user permissions.
HZ Dashboard Radar does not replace WordPress Site Health or a security scanner.
It also does not test Core Web Vitals, detect malware, validate backups, or measure search-engine rankings. That narrower focus is useful because a dashboard widget does not need to become an all-purpose maintenance suite. Instead, the radar can occupy one clear role inside a broader administration workflow: presenting selected activity counters in an easy-to-scan format.
What the Plugin Does Well
Transparency is one of the plugin’s strongest characteristics. When data exists, the interface displays it. When a recognized source does not exist, the plugin can show that the source was not detected.
The radar normalization is also clearly separated from the raw statistics. This reduces the risk that a visual score will accidentally be presented as an actual visitor or engagement number.
Clickable management cards add practical value, while the last-updated indicator gives the dashboard a useful freshness reference. Mobile responsiveness is another important feature because WordPress administrators increasingly work from different devices.
Finally, the plugin stays within the familiar WordPress Dashboard rather than forcing users into a completely separate interface for a quick statistics overview.
Areas That Could Be Expanded in Future Versions
A future version could expand source compatibility while preserving the current transparency model.
For example, additional adapters could recognize more popular local statistics plugins. Each adapter should clearly identify the source and avoid treating fundamentally different metrics as interchangeable. Historical reporting could also become useful.
At present, the lightweight trend mechanism focuses on snapshots and short-term movement. A carefully designed history feature could allow administrators to compare seven-day or thirty-day changes without turning the dashboard into an excessively heavy analytics system.
Configuration options might also help advanced users choose which cards appear.
Some websites may not use comments, while others may care more about custom post types, WooCommerce orders, registered users, or another site-specific metric.
However, expansion should remain cautious. Adding every possible statistic could undermine the simplicity that makes the current radar useful.
A Good Dashboard Should Explain Its Numbers
One broader lesson from HZ Dashboard Radar applies to analytics software in general. Numbers without context are dangerous.
A dashboard may look sophisticated while combining unrelated datasets, stale information, estimates, and calculated scores. If users cannot understand where a number came from, they may make decisions based on a false assumption.
HZ Dashboard Radar’s source labels help address this issue.
- “Published posts” is clearer than an unexplained Posts number.
- “Approved comments” explains what is counted.
- “Recent terms” communicates something different from a complete search-history total.
- “No visitor counter” is more truthful than an arbitrary zero.
This approach makes the interface slightly more verbose, but it also makes it more useful. For website administrators, knowing what a metric means is more important than filling every empty space on a chart.
Frequently Asked Questions
What is HZ Dashboard Radar?
HZ Dashboard Radar is a WordPress dashboard plugin that presents selected site statistics through a radar visualization and supporting metric cards. Version 1.0.0 can work with Posts, Comments, Visitors, Searches, and Referral Hits when the required data sources are available.
Does HZ Dashboard Radar use real WordPress data?
For the reviewed version, Posts and Comments come from WordPress counts. Other metrics depend on recognized local sources. When a supported source is unavailable, the plugin is designed to mark that metric as unavailable rather than fabricate a number.
Why are some statistics missing?
Visitors, Searches, and Referral Hits require compatible local data sources. If the plugin cannot detect an expected table, option, or counter structure, the corresponding metric may display “Not detected.”
Does a missing metric mean the plugin is broken?
Not necessarily. A missing metric can simply mean your WordPress installation does not contain a compatible data source for that statistic. Check the source label before troubleshooting the radar itself.
Why does the radar use a 0–100 scale?
The metrics can have dramatically different raw values. The plugin normalizes available counters for the visual chart so one very large value does not make every smaller metric almost invisible. The cards continue to show the raw numbers.
Is the radar score an SEO score?
No. The normalized radar position is not an SEO score, website-quality rating, traffic grade, or recommendation. It exists to make counters with different numerical scales easier to display together.
Can HZ Dashboard Radar replace Google Analytics?
No. It provides a compact WordPress dashboard overview based on supported local data. Dedicated analytics platforms can offer much deeper reporting, attribution, segmentation, events, conversions, and audience analysis.
Can it replace Google Search Console?
No. Internal WordPress searches are different from queries and performance data reported by Google Search Console. The tools serve different purposes and can be used together.
Are Posts and Comments clickable?
Yes. In version 1.0.0, the Posts and Comments cards provide links to their respective WordPress management screens, making it easier to move from the overview to content administration.
Does HZ Dashboard Radar work on mobile?
The plugin includes responsive styling for smaller screens. The chart and metric-card layout are designed to adapt to mobile widths, although administrators should test the interface with their own WordPress configuration and other dashboard plugins.
A Clearer View of Everyday WordPress Activity
HZ Dashboard Radar demonstrates that a useful WordPress statistics tool does not have to overwhelm administrators with hundreds of measurements. Its main value comes from bringing several selected indicators into one visual location. Published Posts and approved Comments provide dependable WordPress-native information. Compatible local counters can extend the dashboard with Visitors, Searches, and Referral Hits. Source-status labels make it clear when those additional measurements are available and when they are not.
The normalized radar makes very different numerical ranges easier to visualize, while raw values remain visible in the cards. Trend indicators add short-term context, clickable cards shorten common administrative workflows, and responsive styling makes the widget more practical beyond desktop screens. Most importantly, the plugin does not need to pretend that every WordPress installation has the same analytics infrastructure. A missing source can remain missing. That simple principle makes the dashboard easier to trust. HZ Dashboard Radar should not be viewed as a replacement for comprehensive analytics, SEO reporting, or professional monitoring platforms. Instead, it works best as a convenient WordPress administration overview that helps site owners see what their local installation can genuinely report.
⚠️ Disclaimer and Source Hygiene
This article is provided for educational and informational purposes. Plugin behavior described here is based on an examination of HZ Dashboard Radar v1.0.0 and relevant WordPress developer documentation. Features, compatibility, database structures, and implementation details may change in later releases.
Always create a reliable backup before installing, replacing, or modifying a WordPress plugin. Test important changes in a staging environment when possible, particularly on production websites that generate revenue or handle customer information.
Statistics should also be interpreted according to their original data source. Page views, unique visitors, users, sessions, searches, referrals, and other analytics concepts are not automatically equivalent.
For privacy, legal, security, accounting, or business-critical questions, consult an appropriately qualified professional and review the documentation for the original tracking systems used by your website.
🔔 For more tutorials like this, consider subscribing to our blog.
📩 Do you have questions or suggestions? Leave a comment or contact us!
🏷️ Tags: HZ Dashboard Radar, WordPress dashboard, WordPress statistics, WordPress analytics, dashboard widget, WordPress plugin, website statistics, WordPress admin, visitor statistics, WordPress tools
📢 Hashtags: #WordPress, #WordPressPlugin, #WordPressDashboard, #WordPressAnalytics, #WebsiteAnalytics, #WordPressTips, #WebDevelopment, #WordPressTools, #WebsiteManagement, #WPAdmin
Sources and References
The primary technical source for this article is the reviewed HZ Dashboard Radar v1.0.0 plugin package. Its PHP implementation defines the dashboard widget, metric sources, source-detection logic, snapshot trends, normalization process, capability check, raw-value cards, tooltips, and update information. WordPress Developer Resources documents wp_add_dashboard_widget() as the core function for adding dashboard widgets. The official Dashboard Widgets API also explains the standard WordPress mechanism for extending the administration dashboard.
WordPress documentation confirms that wp_dashboard_setup is the hook used for dashboard customization and for adding dashboard widgets.
The official wp_count_posts() documentation describes the WordPress function used to efficiently retrieve post counts by status.
The official wp_count_comments() documentation describes WordPress’s comment-count information, including approved, pending, spam, trash, and other statuses.
Secondary Sources and Testimonials
No fabricated testimonials or user reviews have been included in this article.
Where subjective experience is discussed, it is presented as a practical interpretation of the plugin’s interface and functionality rather than as a quotation from an unidentified user.
Future testimonials should be added only when they come from identifiable, permission-based, or otherwise verifiable sources. Avoid creating fictional endorsements simply to make a WordPress product appear more established than it is.